Difference between revisions of "Air Pollution"
(Created page with "Air Pollution Map Air Pollution is generated by some buildings, is effected by the wind, and can negatively impact Health ...") |
|||
| (7 intermediate revisions by 2 users not shown) | |||
| Line 1: | Line 1: | ||
| − | [[File:Air | + | [[File:Air pollution map.jpg|400px|thumb|right|Air Pollution Map]] |
| − | + | [[File:wind data map.jpg|400px|thumb|right|Wind Data Map]] | |
:''Main article: [[Pollution]]'' | :''Main article: [[Pollution]]'' | ||
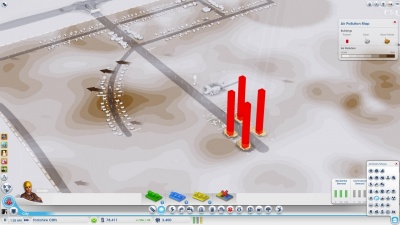
| + | Air Pollution is generated by some buildings, is effected by the [[wind]], and can negatively impact [[Health]] and [[happiness]] when it blows across areas where your population works or lives. Over time Air pollution levels in a [[region]] can increase and produce a haze that hangs in the air. | ||
| + | |||
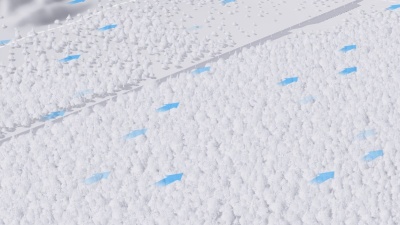
| + | *[[File:wind data map.png]][[#Data Maps|Wind data map]] uses blue arrows to show the direction of the wind blowing over your city. Be sure to construct your [[#Sources|dirty buildings]] at the edge of your city, in the direction of the arrows. | ||
__TOC__ | __TOC__ | ||
==Sources== | ==Sources== | ||
| − | + | These buildings are the major contributors of air pollution: | |
| − | * | + | *[[Industrial Zone|Industrial buildings]] |
| − | *Coal Power | + | *[[Coal Power Plant]]s (this can be minimized with upgraded attachments) |
| − | *Oil Power | + | *[[Oil Power Plant]]s (this can be minimized with upgraded attachments) |
*[[Garbage Dump]]s with the [[Garbage Incinerator]] attachment | *[[Garbage Dump]]s with the [[Garbage Incinerator]] attachment | ||
| + | *[[region|Regional]] air pollution level - this is caused by air pollution that has exited cities in the region. | ||
==Clean Up== | ==Clean Up== | ||
| − | As mentioned air pollution | + | As mentioned air pollution flows with the wind, if you remove the source buildings most of it will go away. However there are ways to remove it faster or combat it if you cannot remove the source buildings. If the air pollution seems to randomly appear from an unpolluted part of the city, it is because the air pollution in the region has accumulated to a high level. To combat this use one of these two methods. |
*Trees | *Trees | ||
*Nature Parks | *Nature Parks | ||
| + | |||
| + | ==Data Maps== | ||
| + | Air Pollution Map - shows the location and direction of flow of air pollution along with the buildings that are produces it. | ||
| + | |||
| + | Wind Map - shows the direction of wind in a city. | ||
Latest revision as of 07:44, 13 May 2013
- Main article: Pollution
Air Pollution is generated by some buildings, is effected by the wind, and can negatively impact Health and happiness when it blows across areas where your population works or lives. Over time Air pollution levels in a region can increase and produce a haze that hangs in the air.
 Wind data map uses blue arrows to show the direction of the wind blowing over your city. Be sure to construct your dirty buildings at the edge of your city, in the direction of the arrows.
Contents
Sources
These buildings are the major contributors of air pollution:
- Industrial buildings
- Coal Power Plants (this can be minimized with upgraded attachments)
- Oil Power Plants (this can be minimized with upgraded attachments)
- Garbage Dumps with the Garbage Incinerator attachment
- Regional air pollution level - this is caused by air pollution that has exited cities in the region.
Clean Up
As mentioned air pollution flows with the wind, if you remove the source buildings most of it will go away. However there are ways to remove it faster or combat it if you cannot remove the source buildings. If the air pollution seems to randomly appear from an unpolluted part of the city, it is because the air pollution in the region has accumulated to a high level. To combat this use one of these two methods.
- Trees
- Nature Parks
Data Maps
Air Pollution Map - shows the location and direction of flow of air pollution along with the buildings that are produces it.
Wind Map - shows the direction of wind in a city.

